Trading Insights Through Volume: Trend Confirmation
Introduction
Differentiating between real and fake market movements is a constant difficulty for traders in today's volatile financial markets. When mistaken for genuine trading opportunities, market noise—which is typified by transient price swings and false breakouts—can result in significant losses. This problem is especially severe in breakout trading, where success depends on accurately spotting long-term price trends.
This implementation offers an improved trend confirmation approach that blends price action and volume analysis to overcome these issues. Based on the idea that notable market changes are usually followed by above-average trading volume, the method uses volume as a crucial validation criterion. It helps weed out misleading signals and find more trustworthy trading opportunities by requiring both price breakouts and volume surges to line up. By ensuring that market moves are backed by enough trading activity, this dual-confirmation strategy seeks to improve trade quality and raise the likelihood of persistent price direction.
The Enhanced Trend Confirmation Technique
To build a strong trading system, the Enhanced Trend Confirmation Technique combines several analytical elements. Fundamentally, the technique uses price trend analysis by looking at support and resistance levels to find possible breakout chances when price activity clearly breaks through these limits. In order to adjust to shifting market circumstances, the system continually tracks price movements across a variety of periods and determines dynamic support and resistance zones based on recent price history.
The crucial secondary validation method is volume confirmation, which requires trading volume to surpass a certain level above its moving average in order to validate a trade signal. Because it confirms the intensity and possible persistence of price fluctuations, this volume component is very important. In order to guarantee that the price breakout is supported by substantial market activity, the method particularly searches for volume spikes of 50% or more over the normal trading volume during a 20-period lookback window.
Together, these elements provide an all-encompassing trade system. The system evaluates the associated volume data as soon as a price breakout takes place. Only when all of these factors are met—a distinct price breakout and much higher volume—does the technique produce a trade signal. Since real market movements usually show both price momentum and increased trading activity, this dual-confirmation method aids in weeding out fake breakouts and low-probability setups. By using dynamic stop-loss and take-profit levels based on Average True Range (ATR) computations, the framework further improves trade management and makes sure risk management adjusts to the volatility of the market.
This code implements a sophisticated trading strategy that combines three key technical analysis components for trend confirmation. At its core, the strategy monitors for volume breakouts that exceed a 50% increase over the historical average, calculated across a 20-period lookback window. This volume analysis is augmented by price action confirmation, where the system identifies support and resistance levels from recent price history and validates breakouts when price closes beyond these levels.
An LSTM neural network with 32 hidden nodes that examines volume patterns is used in the technique to integrate machine learning. With every new candle, this neural network changes its predictions, adding another level of verification to the volume breakouts. The algorithm executes trades using ATR-based position sizing when all three elements are in alignment: high volume, a verified price breakout, and LSTM validation.
Implementing risk management is essential, and dynamic stop-loss and take-profit levels are defined using the Average True Range (ATR). A good risk-reward ratio is produced by setting the take-profit objective at 3 ATR and the stop-loss at 2 ATR from entry. Additionally, the system has protections against multiple positions, guaranteeing that there is never more than one current trade.
**
Implementation of the Strategy**
The Expert Advisor uses a number of essential elements to carry out a methodical breakout trading strategy. In order to quantify volatility, the code first sets up ATR indicators and volume analysis parameters. In order to prevent duplicate processing, the OnTick() method acts as the primary entry point throughout execution, initiating analysis only at the beginning of fresh price bars.
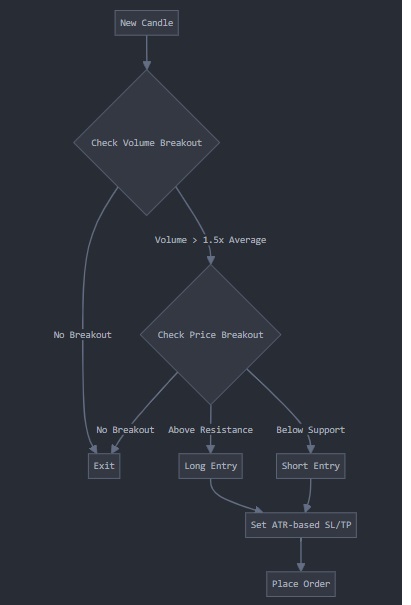
The core logic follows a structured decision tree:
Volume breakout validation through IsVolumeBreakout() checks if current volume exceeds the historical average by the specified threshold (default 50%).
bool IsVolumeBreakout()
{
    double currentVolume = iVolume(_Symbol, PERIOD_CURRENT, 1);
    double avgVolume = 0;

    for(int i = 1; i <= VOLUME_LOOKBACK; i++)
    {
        avgVolume += iVolume(_Symbol, PERIOD_CURRENT, i);
    }
    avgVolume = avgVolume / VOLUME_LOOKBACK;

    .....

    return (currentVolume > avgVolume * VOLUME_THRESHOLD);
}
Price breakout confirmation via IsPriceBreakout() analyzes recent price action to identify breaks above resistance or below support levels.
bool IsPriceBreakout(bool &isLong)
{
    double high[], low[], close[];
    ArraySetAsSeries(high, true);
    ArraySetAsSeries(low, true);
    ArraySetAsSeries(close, true);

    if(CopyHigh(_Symbol, PERIOD_CURRENT, 0, 10, high) <= 0) return false;
    if(CopyLow(_Symbol, PERIOD_CURRENT, 0, 10, low) <= 0) return false;
    if(CopyClose(_Symbol, PERIOD_CURRENT, 0, 10, close) <= 0) return false;

    double resistance = high[1];
    double support = low[1];

    for(int i = 2; i < 10; i++)
    {
        if(high[i] > resistance) resistance = high[i];
        if(low[i] < support) support = low[i];
    }

    ....

    if(close[0] > resistance && close[1] <= resistance)
    {
        isLong = true;
        Print("BREAKOUT ALCISTA DETECTADO");
        return true;
    }
    else if(close[0] < support && close[1] >= support)
    {
        isLong = false;
        Print("BREAKOUT BAJISTA DETECTADO");
        return true;
    }

    return false;
}
Trade execution through PlaceOrder() occurs only when both volume and price conditions align.
Risk management is integrated through multiple mechanisms:
Position sizing is fixed at 0.1 lots per trade
Stop-loss levels are dynamically calculated using ATR multipliers (default 2.0 ATR)
Take-profit targets are set at 3.0 times ATR from entry
The system prevents multiple concurrent positions
Minimum candle confirmation requirement (default 2 candles) helps avoid false breakouts
Trade exits are governed by:
Predefined stop-loss and take-profit levels based on ATR
Single position limit ensures clean entry/exit cycles
All calculations use normalized price values to maintain precision across different instruments
void PlaceOrder(bool isLong)
{
    CTrade trade;
    double price = isLong ? SymbolInfoDouble(_Symbol, SYMBOL_ASK) : SymbolInfoDouble(_Symbol, SYMBOL_BID);

    double atr[], close[];
    ArraySetAsSeries(atr, true);
    ArraySetAsSeries(close, true);

    if(CopyBuffer(atr_handle, 0, 0, 1, atr) <= 0) return;
    if(CopyClose(_Symbol, PERIOD_CURRENT, 0, 1, close) <= 0) return;

    double stopLoss = isLong ? price - (atr[0] * SL_ATR_MULTIPLIER) : price + (atr[0] * SL_ATR_MULTIPLIER);
    double takeProfit = isLong ? price + (atr[0] * TP_ATR_MULTIPLIER) : price - (atr[0] * TP_ATR_MULTIPLIER);

    stopLoss = NormalizeDouble(stopLoss, _Digits);
    takeProfit = NormalizeDouble(takeProfit, _Digits);

    ENUM_ORDER_TYPE orderType = isLong ? ORDER_TYPE_BUY : ORDER_TYPE_SELL;

    ....

    if(PositionsTotal() > 0)
    {
        Print("Ya hay posiciones abiertas, saliendo...");
        return;
    }

    if(!trade.PositionOpen(_Symbol, orderType, 0.1, price, stopLoss, takeProfit))
    {
        ...
        return;
    }

    Print("Orden colocada exitosamente. Dirección: ", isLong ? "LONG" : "SHORT");
}
**
Adaptability and Flexibility**
The multi-component validation method of the technique is what makes it flexible. Volume breakouts in FX markets might suggest the involvement of big market participants, whilst in stocks they frequently imply institutional activity. This method works especially well for commodity markets since volume spikes usually come before big trend changes.
For best results, market-specific calibration is necessary. The volume threshold, which is presently set at 1.5x, may need to be adjusted in extremely liquid markets, such as major forex pairs, in order to filter out noise. The MIN_CANDLES_CONFIRM setting becomes essential for less liquid instruments in order to prevent false breakouts. The HIDDEN_SIZE parameter of the LSTM component should be scaled according to the usual volume patterns of the market; the higher the better for more intricate marketplaces like cryptocurrency.
ATR-based position sizing also offers organic market adaption. The SL_ATR_MULTIPLIER and TP_ATR_MULTIPLIER dynamic stops and targets dynamically adapt to the volatility profile of each instrument. For example, big indexes may profit from tighter settings, while more volatile markets, such as small-cap equities, may benefit from broader stops (higher multiplier).
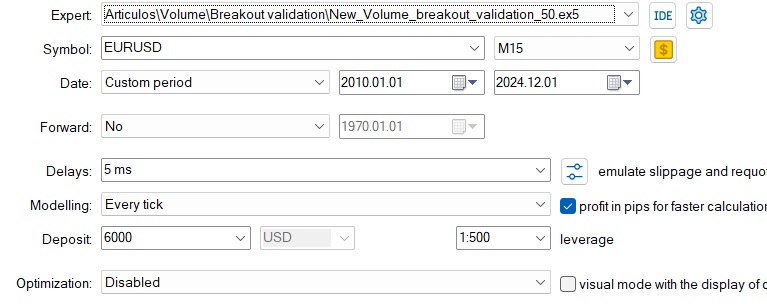

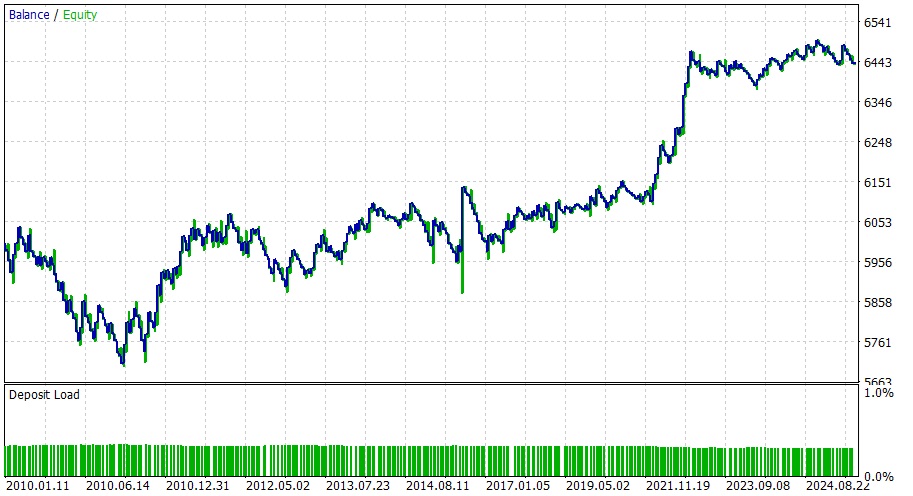
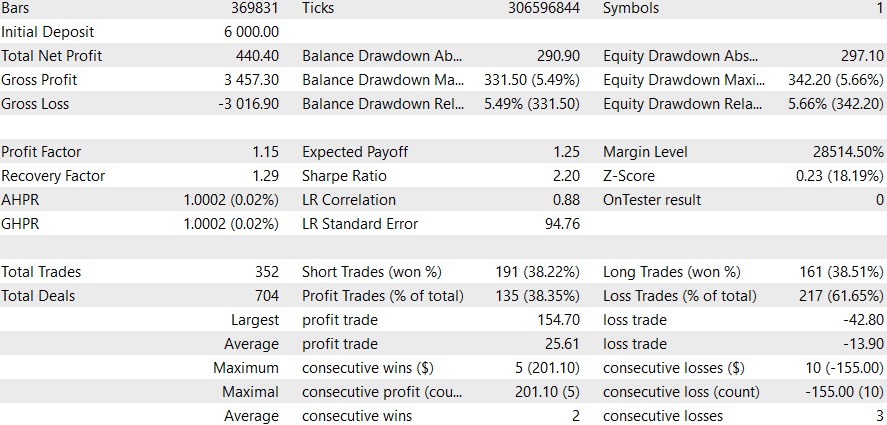
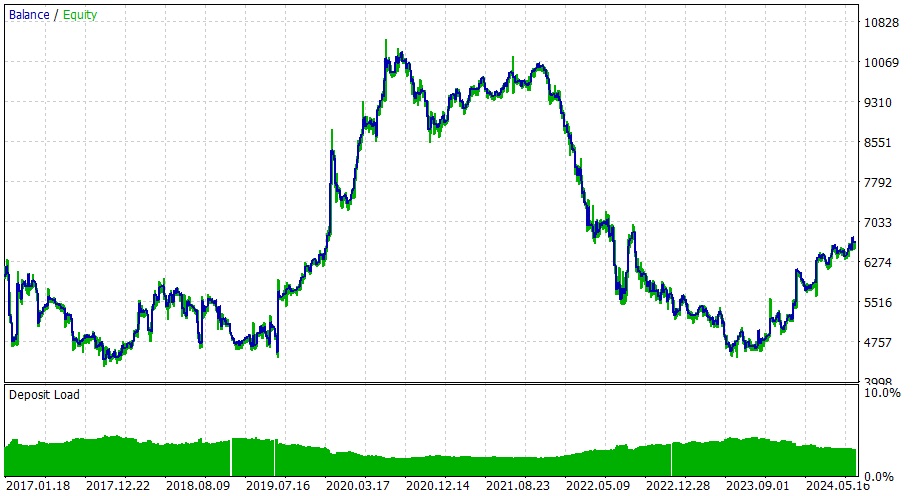
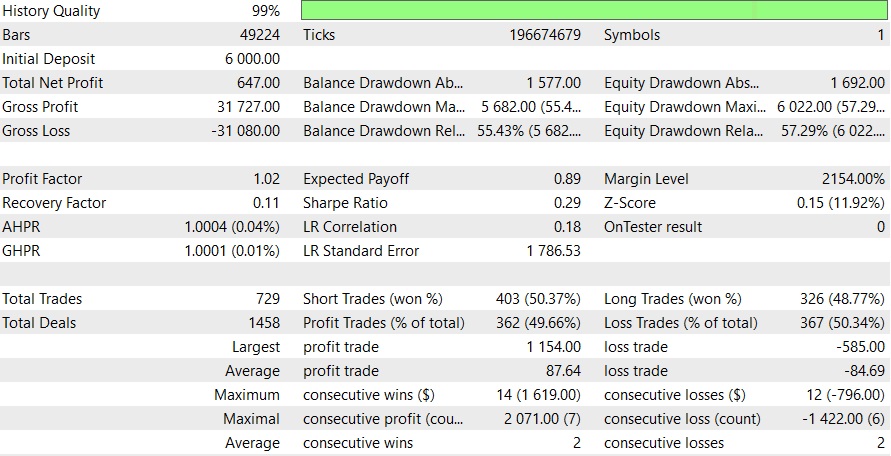
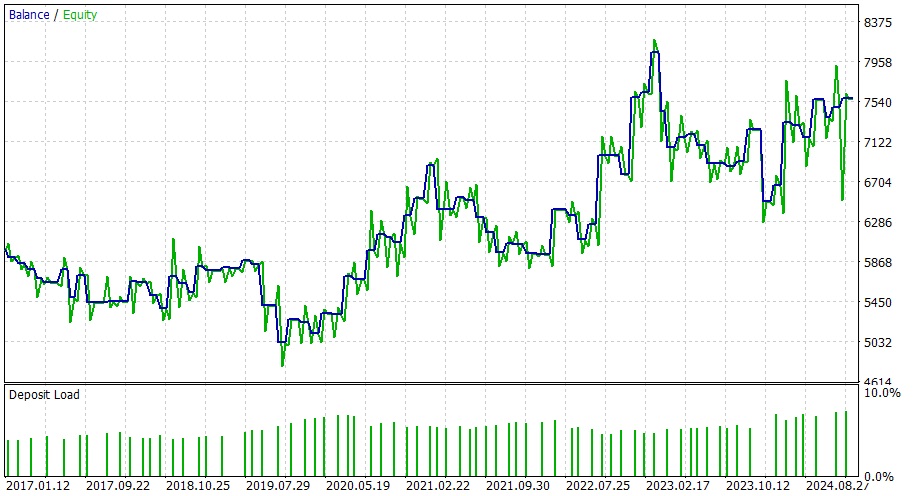
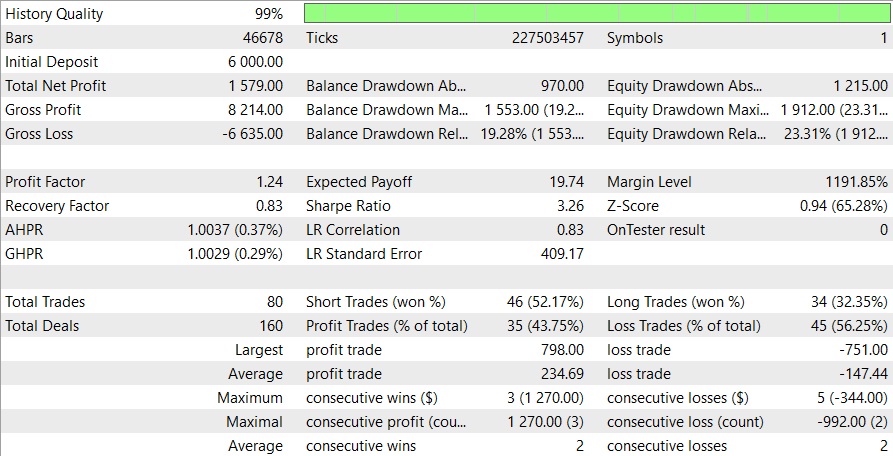
With a solid strategy that combines volume analysis, trend recognition, and LSTM neural network predictions, the EA exhibits encouraging results. Although there may be space for improvement, the equity curve's stability indicates that the risk management system is operating efficiently. The comparatively low profit component suggests a cautious trading strategy, which is usually beneficial for sustainability over the long run.
The system's capability maintain steady performance in spite of the EURUSD market's complexity is quite intriguing. LSTM predictions, trend analysis, and volume threshold are three confirmation variables that seem to work well together for filtering out erroneous signals. An additional degree of security is provided by the use of engulf pattern recognition and pin bar fake breakout detection.
There is room for improvement, though. It appears that the entry/exit criteria might be improved, as indicated by the victory rate of about 50%. Using a more complex exit strategy than the current bar count and false breakout detection is one option. Furthermore, adding modifications for market volatility to the system's volume threshold computations might be advantageous.
Although manageable, the drawdown levels can be decreased by incorporating correlation analysis with other significant currency pairings to prevent overexposure during strongly linked market movements or by introducing dynamic position size depending on market conditions.
A focus on current market activity is suggested by the LSTM implementation's very short input size and lookback periods. Although this seems to function effectively in the current setup, extending the lookback periods might assist identify longer-term market trends and increase the forecast accuracy during significant trend shifts.
Although stability is suggested by the discoveries of conservative profit-taking strategy, there may be chances to scale positions during periods of strong momentum in order to optimize profits during especially advantageous market circumstances.
This Expert Advisor's architecture, which focuses on universal market characteristics like volume analysis and price trends, makes it very flexible for trading a variety of financial instruments outside of only EURUSD.
Because the LSTM neural network is based on relative volume fluctuations and price patterns rather than currency-specific factors, its architecture is particularly adaptable. This implies that it might be used successfully with other important FX pairs, commodities, or even stock indices where price movement is heavily influenced by volume.
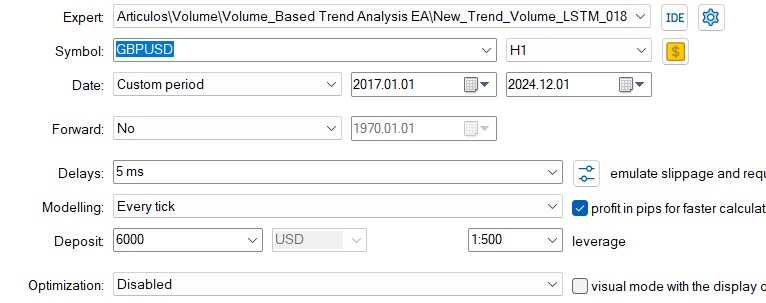
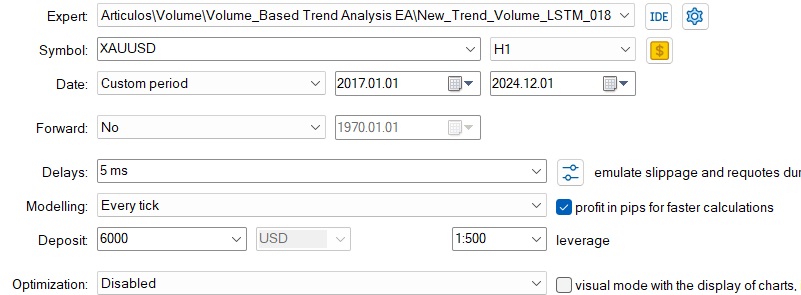
It's crucial to remember that different instruments may require adjustments to the lookback periods and volume threshold multiplier. For example, given of their distinct trading characteristics and usual volume profiles, pairs such as USDJPY or GBPUSD may need various volume criteria. Similarly, because of their distinct market dynamics, commodities like gold or oil may profit from extended lookback periods.
Since pin bars and engulfing patterns are common in all financial markets, the false breakout detection technique that uses them is very inescapable. However, the effectiveness may differ based on each instrument's normal volatility. Wider thresholds for pattern identification, for instance, may be necessary for more volatile instruments.
Although the present EURUSD results offer a solid starting point, traders using this approach on other symbols should anticipate a period of changing for factors such as volume thresholds and the LSTM hidden layer size. One of the strategy's advantages is its flexibility, but it's important to realize that every market has a unique "personality" and trading traits that must be taken into consideration while adjusting the parameter settings.
One could think of developing a self-adjusting mechanism that calibrates the important parameters according to the volume profile and volatility history of each individual instrument in order to achieve the best outcomes across various symbols. This would further increase the strategy's adaptability and resilience to various instruments and market situations.


Conclusion
To sum up, this trading approach has a number of strong benefits that make it a useful instrument for market players. The methodical strategy capitalizes on expected market trends and volatility while reducing emotional decision-making. Through the integration of several technical indicators and strong risk management procedures, the approach offers a thorough framework that is flexible enough to adjust to shifting market circumstances. While enabling meaningful participation in profitable trends, the integrated safeguards—such as position sizing guidelines and stop-loss mechanisms—help protect money during unfavorable market moves.
Above all, traders need to understand that this method is not a "set and forget" undertaking. Continuous observation and frequent parameter adjustment are necessary for success in order to sustain efficacy as market conditions change. Traders should keep thorough records of all their transactions, evaluate performance indicators on a frequent basis, and be ready to make data-driven changes to risk parameters, position sizes, and indicator settings. Long-term success depends on this dedication to constant adaptation and development.
It is recommended that traders who wish to use this technique begin with paper trading in order to become acquainted with the timing and mechanics of entry and exits. Start with lesser position sizes once you're at ease, then progressively increase them as you show reliable execution. Recall that no strategy is effective in every market situation; instead, establish precise rules for when to limit exposure or temporarily withdraw from a strategy in negative circumstances. Establish a solid daily market analysis practice and follow your established guidelines while maintaining the flexibility to adjust to evolving conditions. In the end, focused execution and rigorous approach modification based on thorough result analysis are what lead to success.